Ziply Fleet · Features · Profitability Analytics
Know which freight actually pays
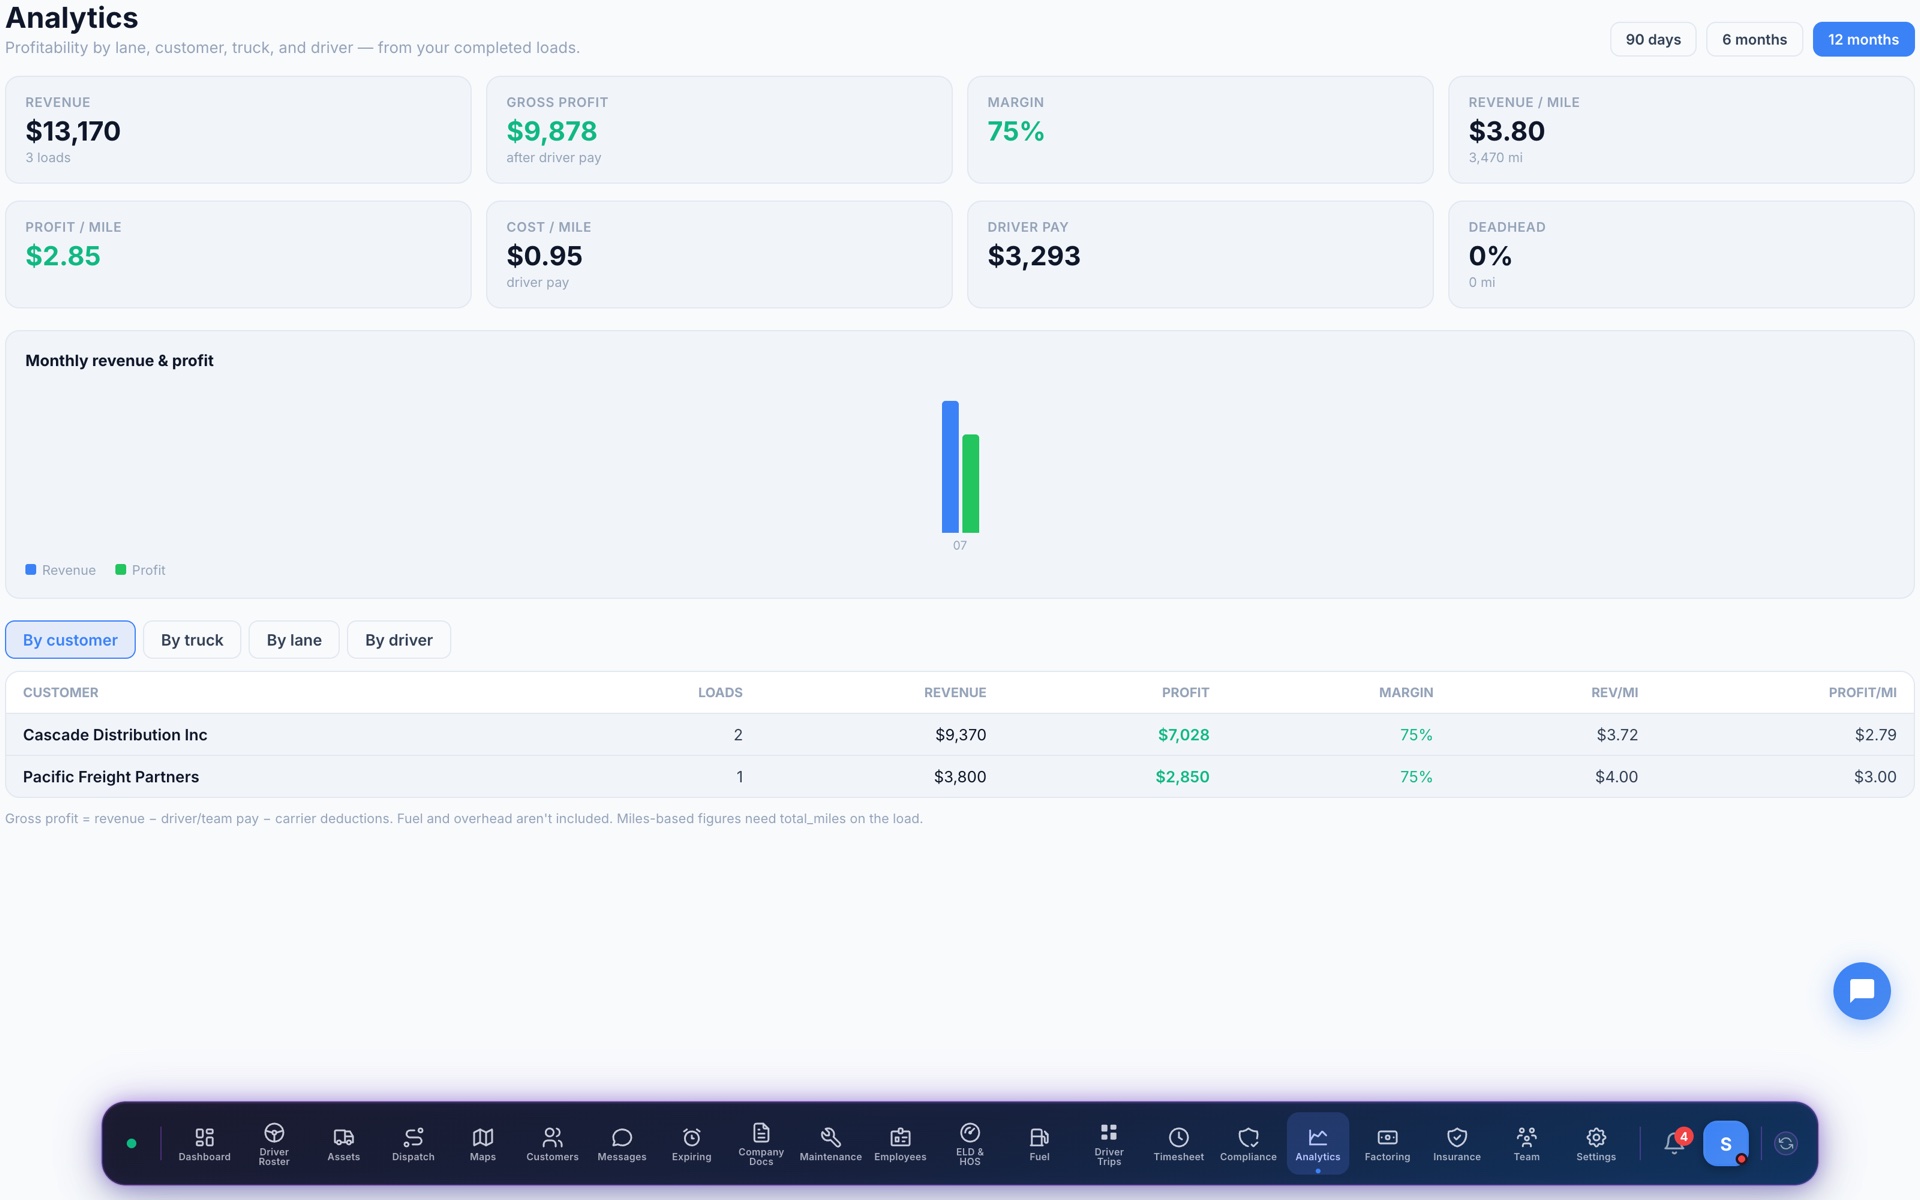
Every completed load feeds a live P&L: revenue, gross profit, margin and dollars-per-mile — sliceable by customer, truck, driver and lane, so you can quote from facts.
Why carriers pick Ziply for profitability analytics
Per-mile truth
Revenue per mile, cost per mile, profit per mile and deadhead percentage — the numbers that decide whether a lane is worth running.
Slice it four ways
By customer to fire the unprofitable one, by truck to spot the money pit, by driver to reward the best, by lane to quote smarter.
No spreadsheet lag
It updates as loads deliver. Month-end looks like every other day.
How it works
- Deliver loads as usual
- Analytics computes profit after driver pay
- Filter by customer, truck, driver, lane
- Quote the next load from real margins